library(digitize)

d <- digitize("images/case-studies/ronnestad2021-hbmass.png")16 Case studies
16.1 Heat suit training in cross-country skiers
Our bodies adapt to warmer environments, in part, by increasing blood volume, including the oxygen-carrying molecule hemoglobin (Doupe et al. 1957). By combining regular endurance training with heat stress, total hemoglobin mass can be increased by nearly 5% in well-trained athletes (Rønnestad et al. 2021). Rønnestad et al. (Rønnestad et al. 2022) tested whether training with a heat suit could also increase total hemoglobin mass, as observed with training in a warm environment. The researchers randomized 25 cross-country skiers to either heat suit training (HEAT) or control training (CON). The HEAT group trained for 50 minutes with a heat suit, at low intensity, five times per week for five weeks. In this case study, we will reanalyze the data set from (Rønnestad et al. 2022).
Doupe, J., M. H. Ferguson, and J. A. Hildes. 1957. “Seasonal Fluctuations in Blood Volume.” Canadian Journal of Biochemistry and Physiology 35 (3): 203–13.
Rønnestad, Bent R., Ole Martin Lid, Joar Hansen, et al. 2022. “Heat Suit Training Increases Hemoglobin Mass in Elite Cross-Country Skiers.” Scandinavian Journal of Medicine & Science in Sports, March, sms.14156. https://doi.org/10.1111/sms.14156.
16.1.1 Before analysis
Before we begin our analysis of the data we have, it is worth considering what we could find. Depending on your philosophical stance, available software, and research question, you likely want to assess the strength of your research design. In this case (we are reanalyzing data), we cannot redesign the study, but we can determine the power of the available study design for a given expected effect size. This approach builds on the frequentist idea that, if we were to conduct a large number of repeated studies, the design we use would lead to rejection of the null hypothesis in favour of the alternative hypothesis, given that an effect size of interest actually exists in the population. Since we already have a sample size, the question in our power analysis becomes, what is the power of our design, given a specified sample size and an effect size of interest? There are several ways to think about this problem. Lakens (2022) lists several approaches to determine desirable frequentist error rates and effect sizes of interest.
Lakens, Daniël. 2022. “Sample Size Justification.” Collabra: Psychology 8 (1): 33267. https://doi.org/10.1525/collabra.33267.
Rønnestad, Bent R., Håvard Hamarsland, Joar Hansen, et al. 2021. “Five Weeks of Heat Training Increases Haemoglobin Mass in Elite Cyclists.” Experimental Physiology 106 (1): 316–27. https://doi.org/10.1113/EP088544.
What is the minimum effect size of interest in this case? Since the study aims to determine whether heat suit training can increase Hbmass, we might consider the minimum effect of interest to be the effect achieved with heat (chamber) training (Rønnestad et al. 2021). Were do we get this information? In previous research! Sometimes, the data is not available in spreadsheets, but as data presented in a paper. In (Rønnestad et al. 2021), we find that the Hbmass values of individual participants are visualized. If in R, we could use a package called digitize to manually import the data from the graph ?fig-digitize. For this case study, I’ve made the data available in the exscidata package under hbmass.
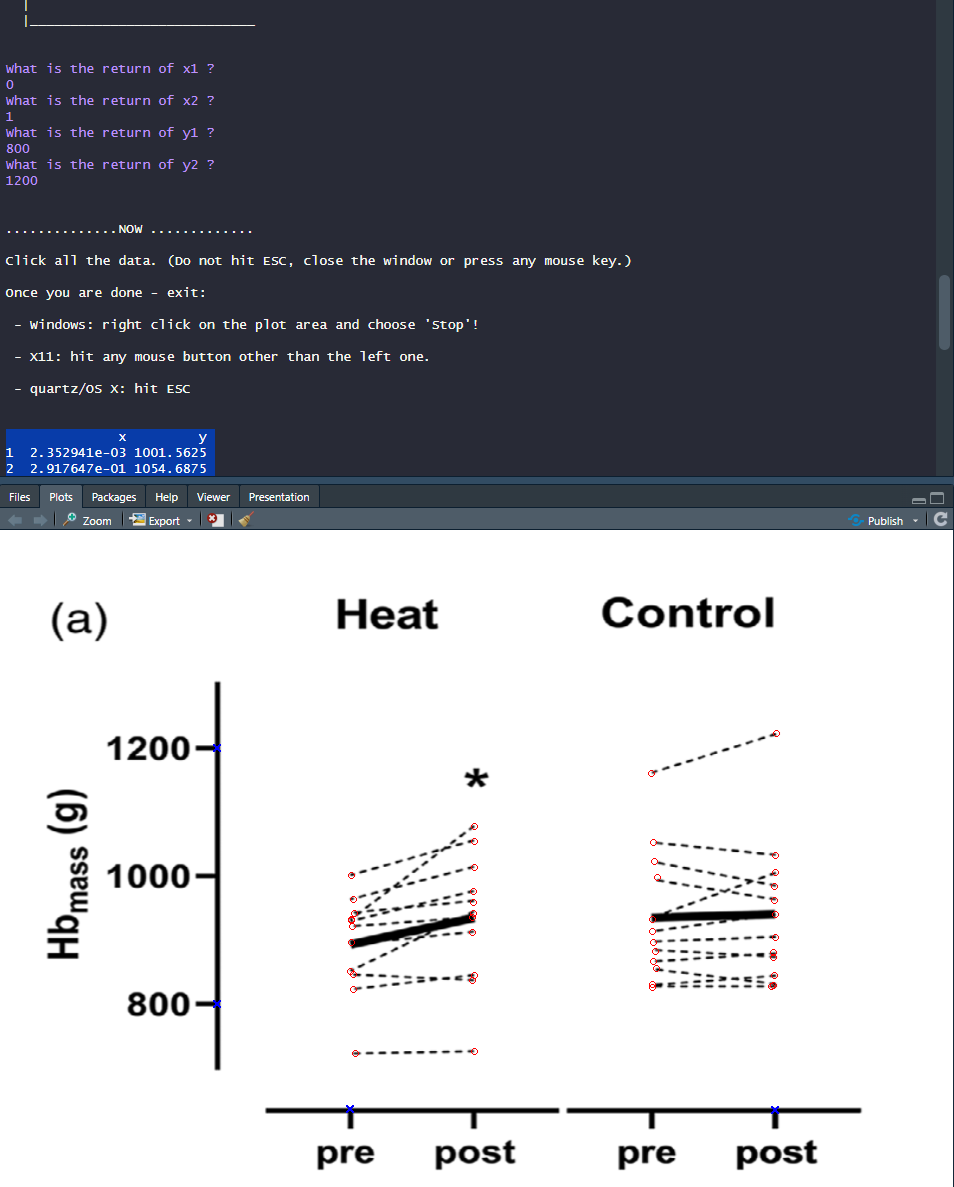 {#fig-digitize}
Here, the study design is fixed, but if we were to redesign it, the question could be rephrased as a test of equivalence between heat chamber training and heat suit training. We could determine if the two approaches affected Hbmass to a similar extent. This analysis would require an equivalence test (Mazzolari et al. 2022).
Mazzolari, Raffaele, Simone Porcelli, David J. Bishop, and Daniël Lakens. 2022. “Myths and Methodologies: The Use of Equivalence and Non-Inferiority Tests for Interventional Studies in Exercise Physiology and Sport Science.” Experimental Physiology 107 (3): 201–12. https://doi.org/10.1113/EP090171.