Associations - Regression and Correlation
The regression model
- The ordinary regression model \(y_i = \beta_0 + \beta x_i + \epsilon_i\) gives us the relationship between two variables, \(x\) and \(y\).
- The correlation can be used to describe the same relationship using a unit-less number between -1 and 1.
- A correlation of 0 indicate no association, a correlation close to 1 and -1 indicate association.

The relationship between training volume and vastus lateralis thickness
Are assumptions met?
- No apparent curve-linear relationship
- There are no obvious outliers, and
- Both variables are evenly distributed (normally distributed)
The relationship between training volume and vastus lateralis thickness
Using the correlation for inference
- We might want to say something about the population from where we have gathered participants
- The correlation coefficient can be used for hypothesis testing using the
cor.testfunction
    Pearson's product-moment correlation

data:  hypertrophy$VL_T1 and hypertrophy$SQUAT_VOLUME
t = 3.335, df = 27, p-value = 0.00249
alternative hypothesis: true correlation is not equal to 0
95 percent confidence interval:
 0.2164913 0.7568216
sample estimates:
      cor
0.5401395
Correlation and univariate regression
- The correlation coefficient is a simplification of a univariate regression.
- We will get the same results from
lm(\(\sqrt{R^2}\)) as the estimate fromcor.test
R from lm
0.5401395
Correlation estimate from cor.test
0.5401395 The correlation comes in many forms
When assumptions about normally distributed variables and outliers are questioned we may use a rank-based correlation.
Spearman’s or Kendall’s correlation coefficient are both alternatives to the Pearson correlation coefficient
Spearman’s \(\rho\) is simply the correlation coefficient calculated from ranked values
In R
## Ranking is sensitive to missing values
dat <- hypertrophy %>%
        select(VL_T1, SQUAT_VOLUME) %>%
         filter(!is.na(VL_T1),
               !is.na(SQUAT_VOLUME))

# The spearman method
with(dat,
     cor.test(VL_T1,
              SQUAT_VOLUME,
              method = "spearman"))

# Pearson method on ranked data
with(dat,
     cor.test(rank(VL_T1),
              rank(SQUAT_VOLUME),
              method = "pearson"))
    Spearman's rank correlation rho

data:  VL_T1 and SQUAT_VOLUME
S = 1609.8, p-value = 0.0005285
alternative hypothesis: true rho is not equal to 0
sample estimates:
      rho
0.6035045
    Pearson's product-moment correlation

data:  rank(VL_T1) and rank(SQUAT_VOLUME)
t = 3.9329, df = 27, p-value = 0.0005285
alternative hypothesis: true correlation is not equal to 0
95 percent confidence interval:
 0.3043080 0.7943169
sample estimates:
      cor
0.6035045
Many types of associations
- A broader definition of association can include…
- Diffrences in body weight between sexes → sex (discrete) is associated with body weight (continuous)
- Prevalence of ACL injuries differ between sexes → sex (discrete) is associated with injury status (discrete).
- We use numerous statistical tests to describe associations (t-test, ANOVA, regression, etc.)
Associations and causality

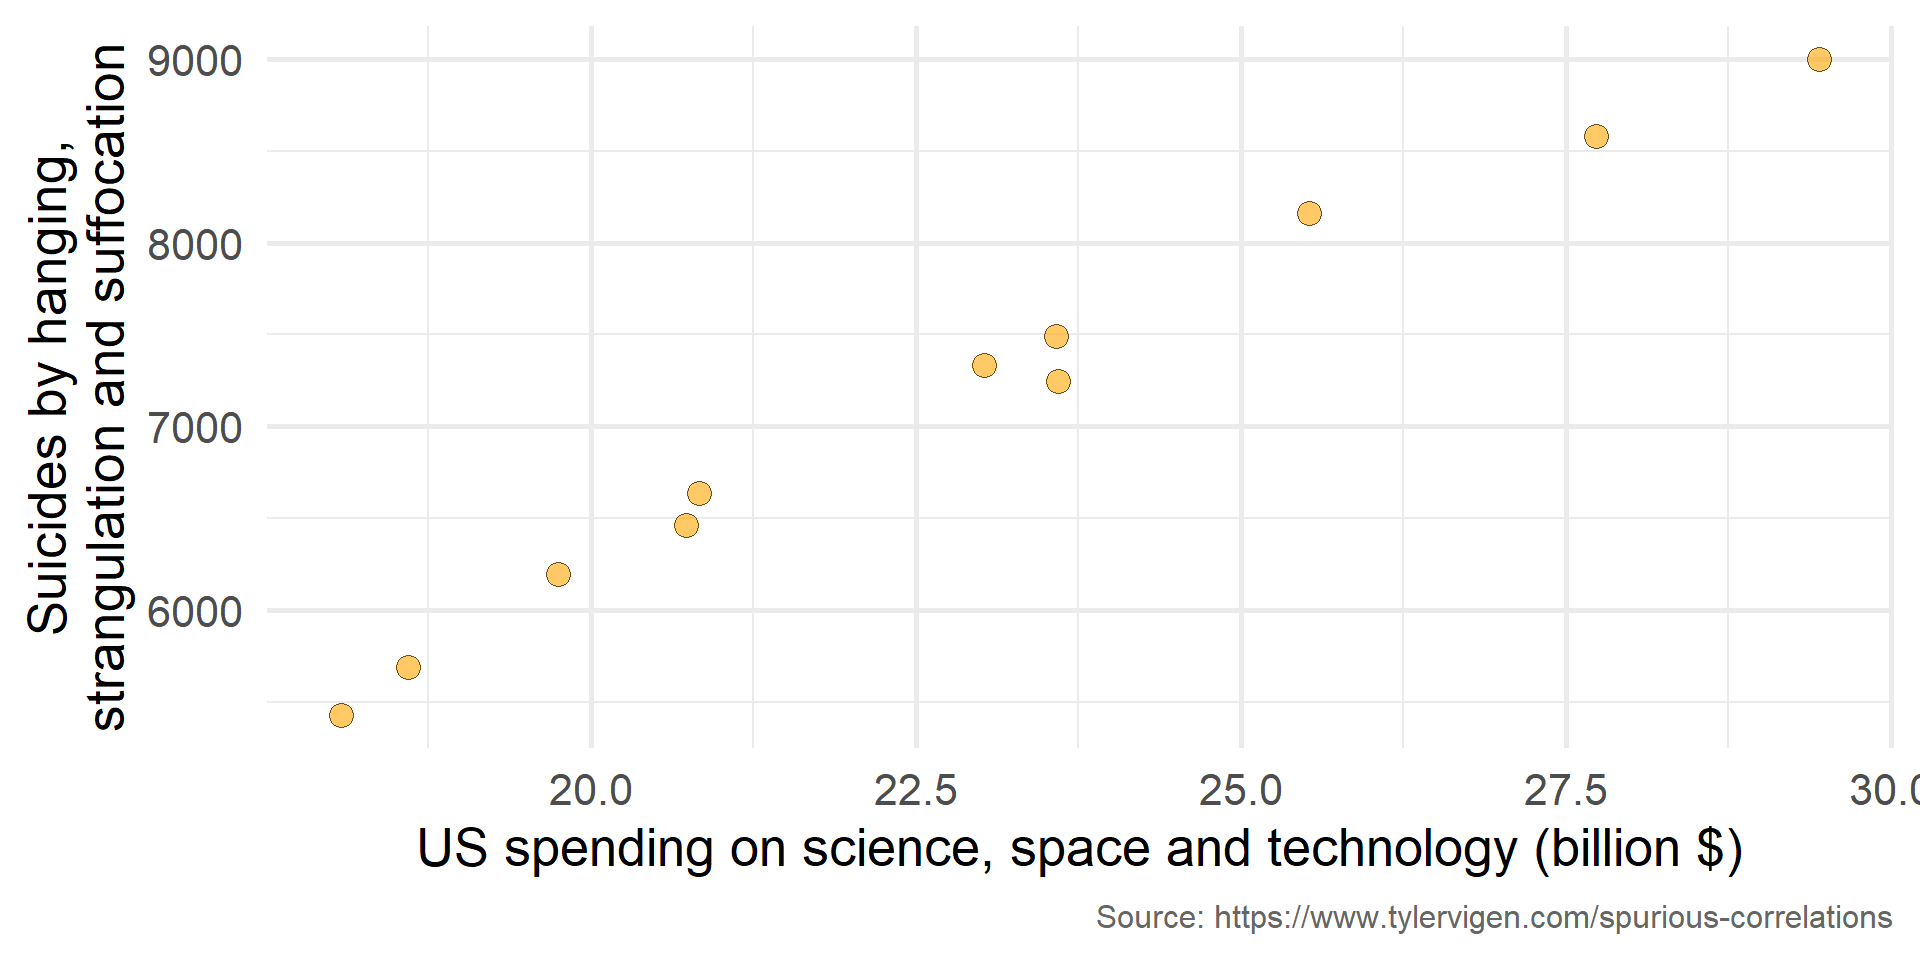
Figure 1: US spending on science, space and technology is positively related to the number of suicied by hanging, strangulation and suffocation.
Associations and causality
- Associations are descriptive → We observe statistical associations without being able to infer causality
- Controlled experiments can be used to infer causality → Using experiments we can intervene in a system and interpret associations as causal (intervention associated with outcome)
- Using graphs we can draw assumptions about relationships among variables
The experimental treatment (E) is causally associated with the outcome (O)

In obeservational settings, an exposure (E) may be indirectly related to an outcome (O) trough a confounder (C)

Summary
- The correlation analysis can be seen as a simplified regression analysis
- Correlation and regression are used to quantify associations
- Associations are what we describe with (many) statistical tests
- Association do not imply causation
- Graphs can be used to draw assumptions about associations
