Data visualization
Why graphs?
- “… to help us perceive broad features of the data”
- “… to let us … see what else is there.”
(Anscombe 1973)
Four data sets - Anscombe’s quartet
Summary statistics for Anscombe’s data
| 1 |
x |
9.0 |
3.3 |
4.0 |
14.0 |
| 2 |
x |
9.0 |
3.3 |
4.0 |
14.0 |
| 3 |
x |
9.0 |
3.3 |
4.0 |
14.0 |
| 4 |
x |
9.0 |
3.3 |
8.0 |
19.0 |
| 1 |
y |
7.5 |
2.0 |
4.3 |
10.8 |
| 2 |
y |
7.5 |
2.0 |
3.1 |
9.3 |
| 3 |
y |
7.5 |
2.0 |
5.4 |
12.7 |
| 4 |
y |
7.5 |
2.0 |
5.2 |
12.5 |
(Anscombe 1973)
Anscombe’s quartet (2)
Regression coeficients for for Anscombe’s data
| 1 |
3 |
0.5 |
0.82 |
| 2 |
3 |
0.5 |
0.82 |
| 3 |
3 |
0.5 |
0.82 |
| 4 |
3 |
0.5 |
0.82 |
(Anscombe 1973)
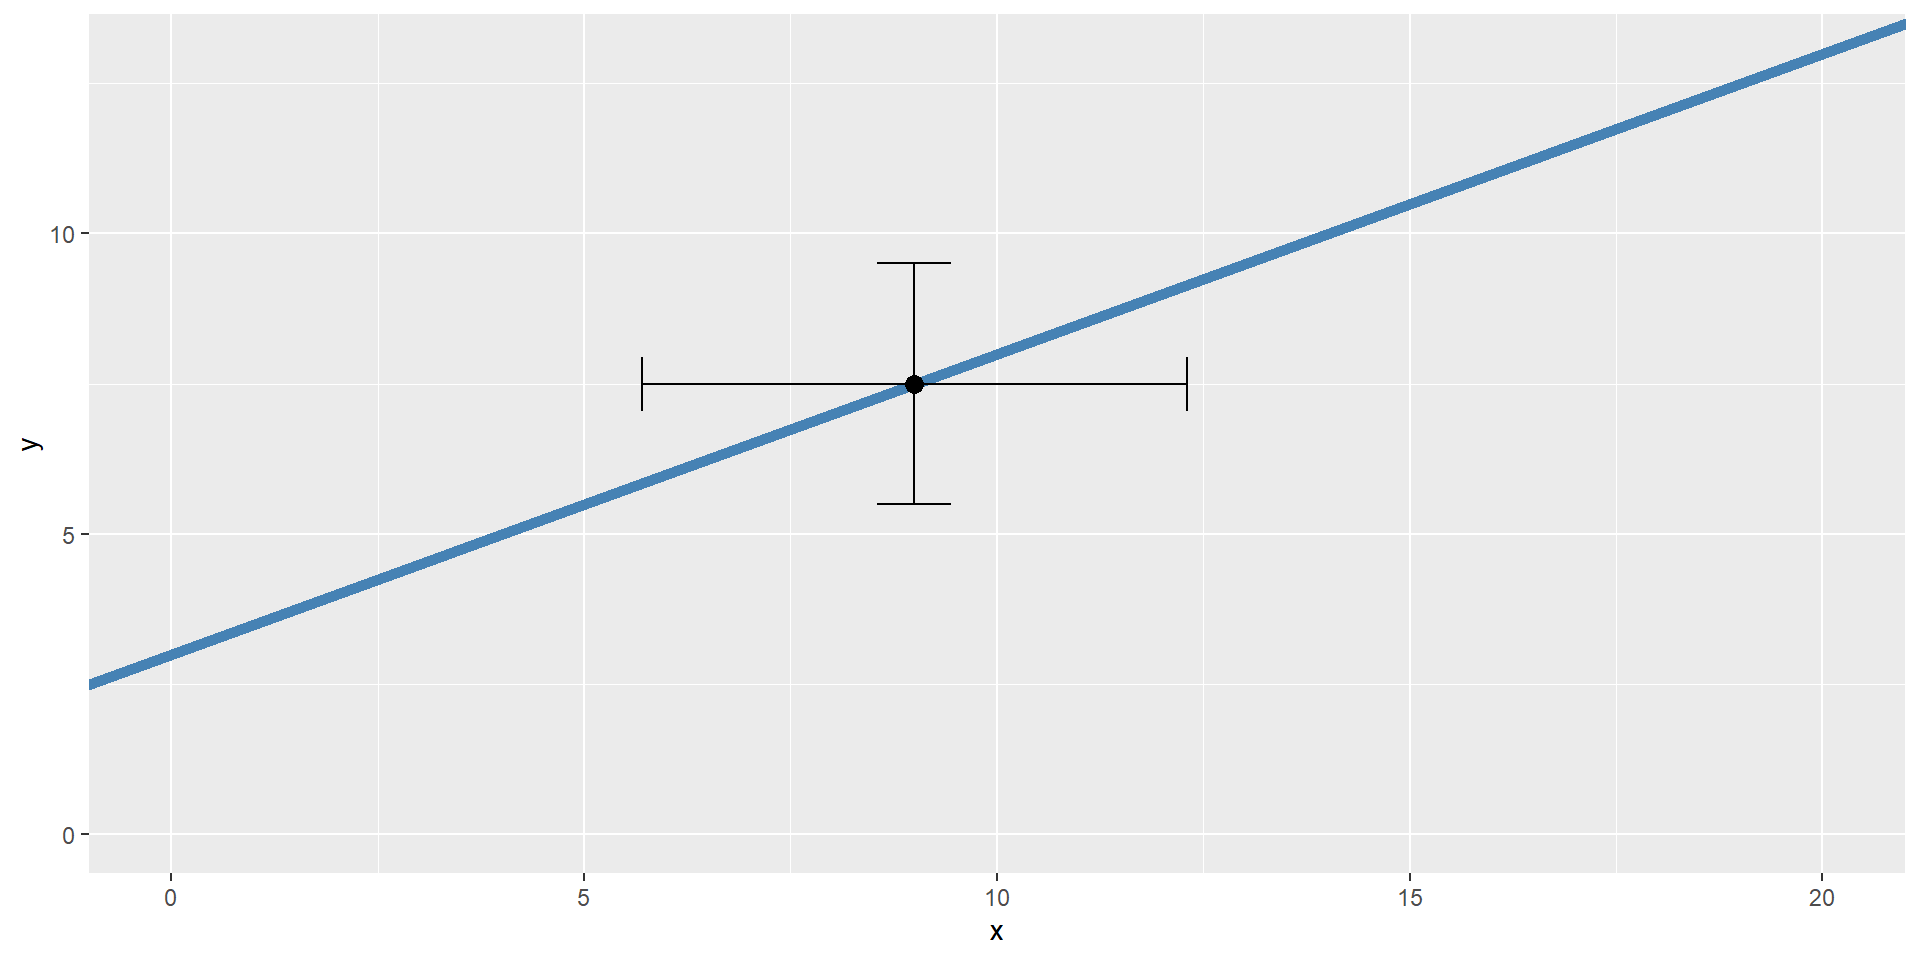
A best guess of the data pattern
![]()
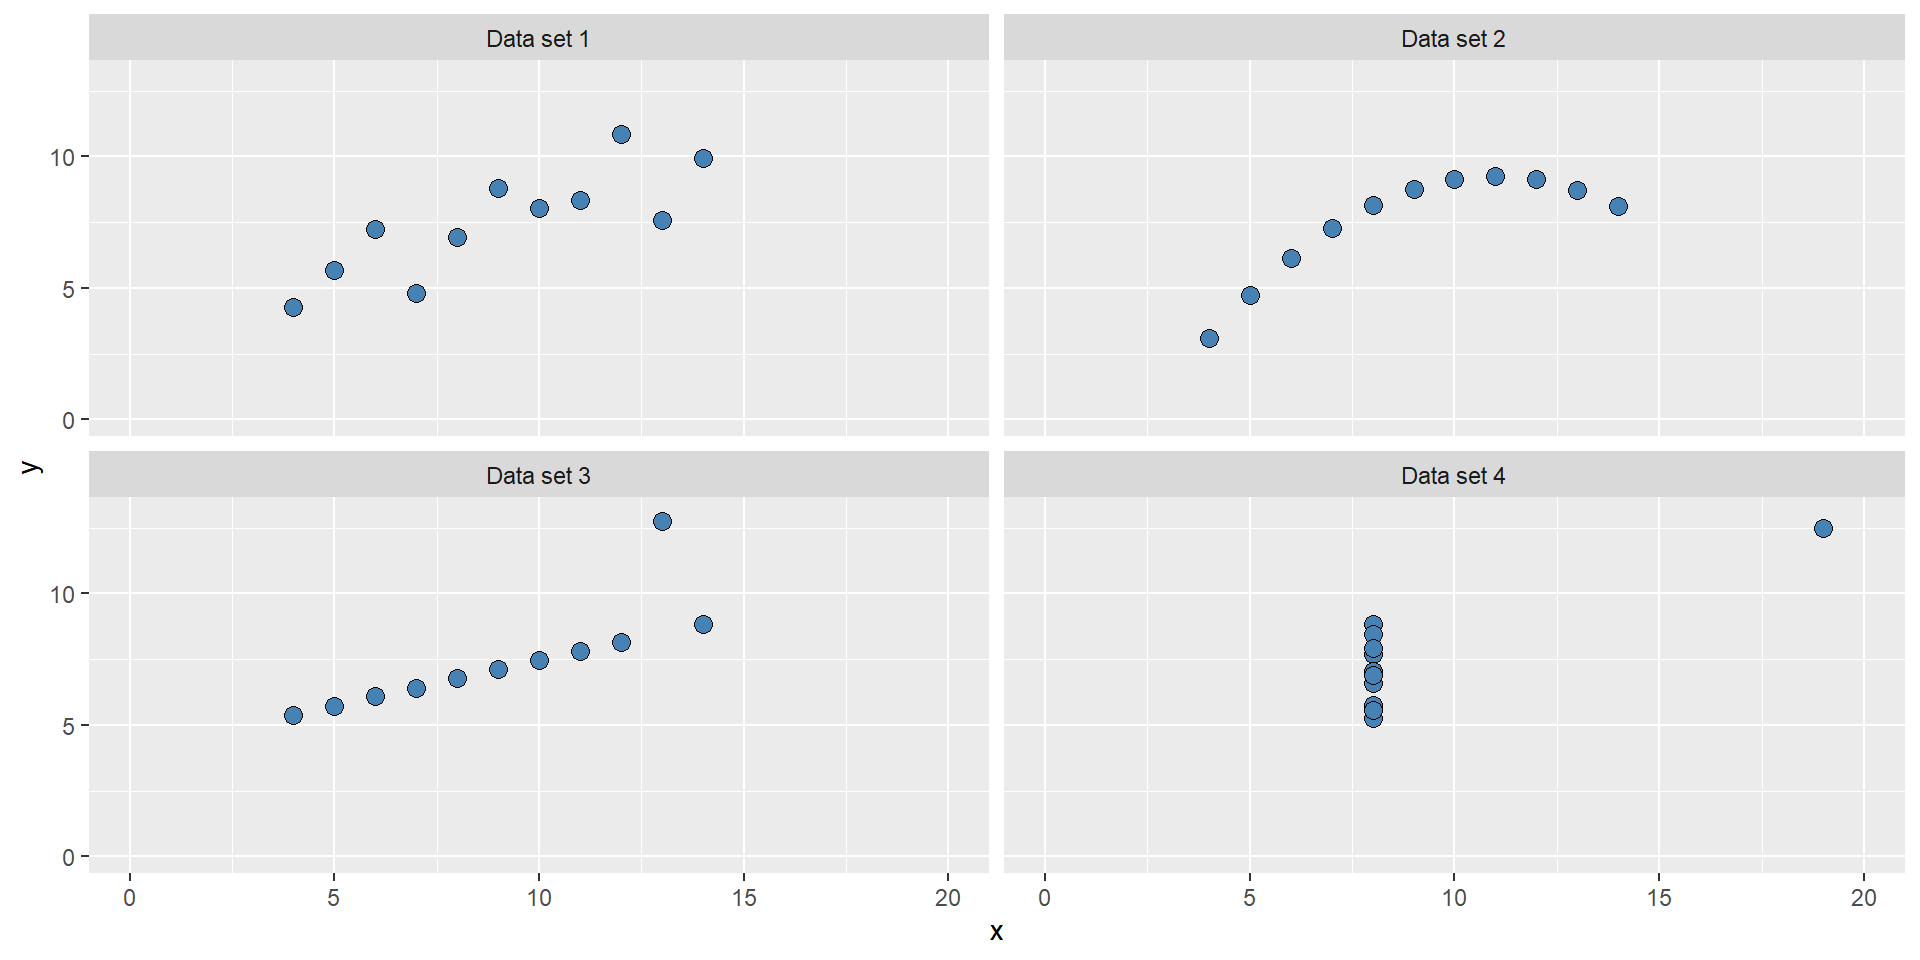
Plotting the actual data
![]()
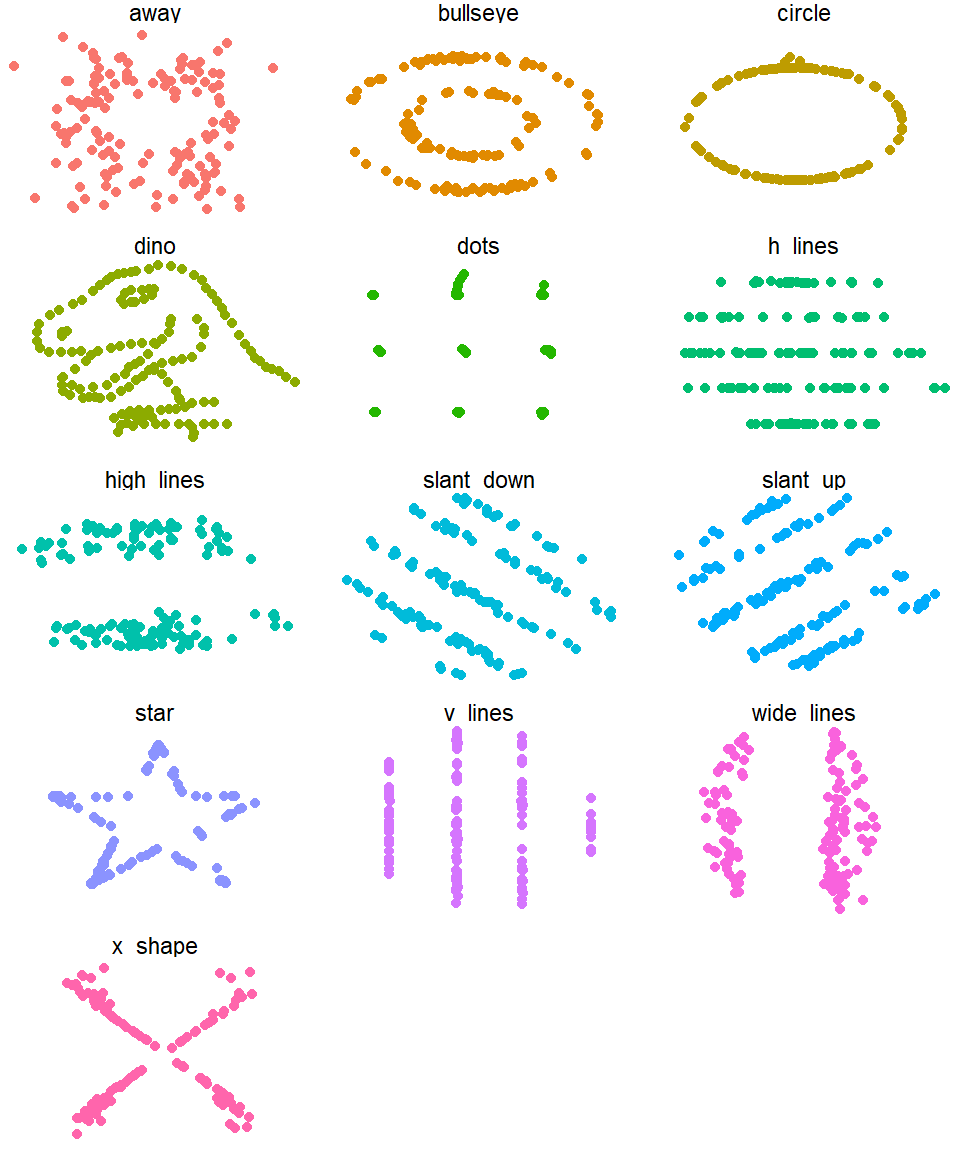
Another example - The Datasaurus
The Datasaurus datasets
| away |
54.27 |
47.83 |
16.77 |
26.94 |
-0.06 |
| bullseye |
54.27 |
47.83 |
16.77 |
26.94 |
-0.07 |
| circle |
54.27 |
47.84 |
16.76 |
26.93 |
-0.07 |
| dino |
54.26 |
47.83 |
16.77 |
26.94 |
-0.06 |
| dots |
54.26 |
47.84 |
16.77 |
26.93 |
-0.06 |
| h_lines |
54.26 |
47.83 |
16.77 |
26.94 |
-0.06 |
| high_lines |
54.27 |
47.84 |
16.77 |
26.94 |
-0.07 |
| slant_down |
54.27 |
47.84 |
16.77 |
26.94 |
-0.07 |
| slant_up |
54.27 |
47.83 |
16.77 |
26.94 |
-0.07 |
| star |
54.27 |
47.84 |
16.77 |
26.93 |
-0.06 |
| v_lines |
54.27 |
47.84 |
16.77 |
26.94 |
-0.07 |
| wide_lines |
54.27 |
47.83 |
16.77 |
26.94 |
-0.07 |
| x_shape |
54.26 |
47.84 |
16.77 |
26.93 |
-0.07 |
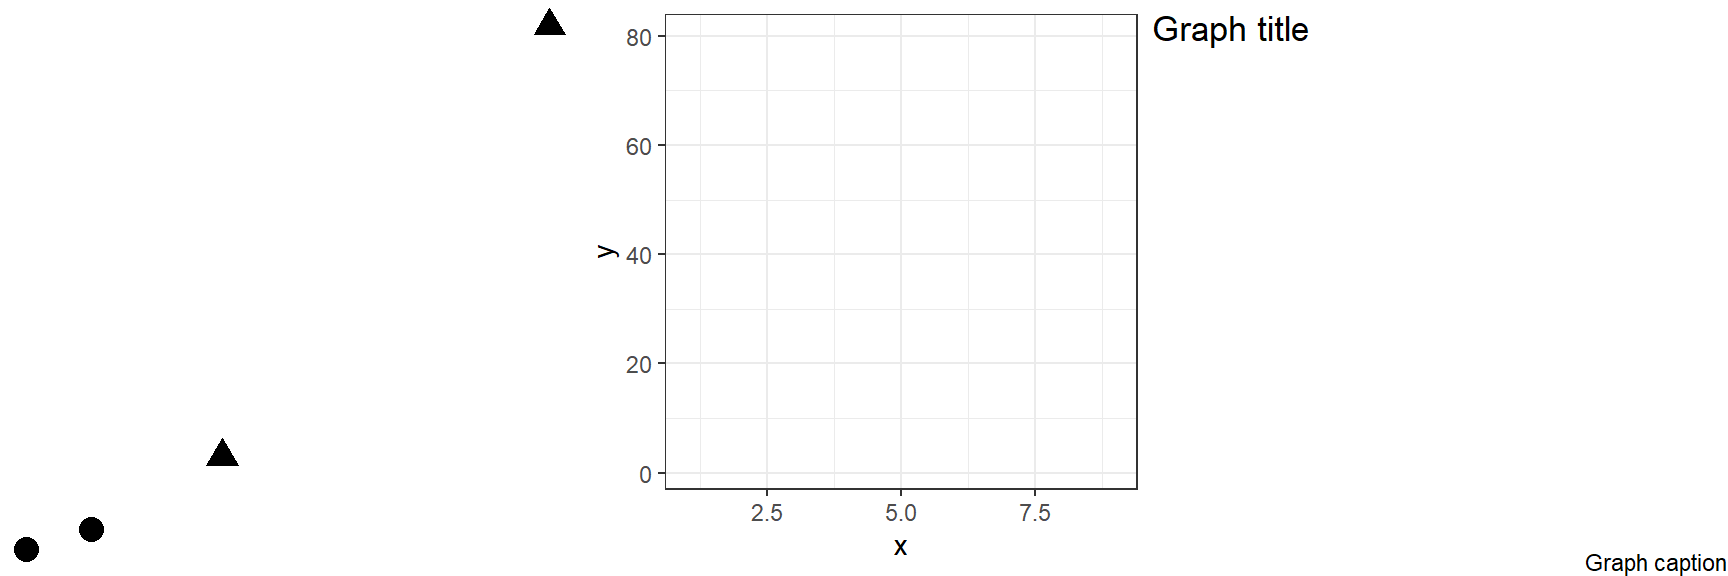
A system for creating graphs in R
![]()
Three layers of a graph, geometric objects, scales and coordinates and annotations of the plot
(Wickham 2010)
A system for creating graphs
![]()
Three layers of a graph put together, geometric objects, scales and coordinates and annotations of the plot
(Wickham 2010)
ggplot2 - Grammar of graphics
data → The dataset containing variables to plotaesthetics → Scales where the data are mappedgeometries → Geometric representations of the datafacet → A part of the datasetstatistical transformations → Summaries of datacoordinates → The coordinate spacethemes → Plot components not linked to data
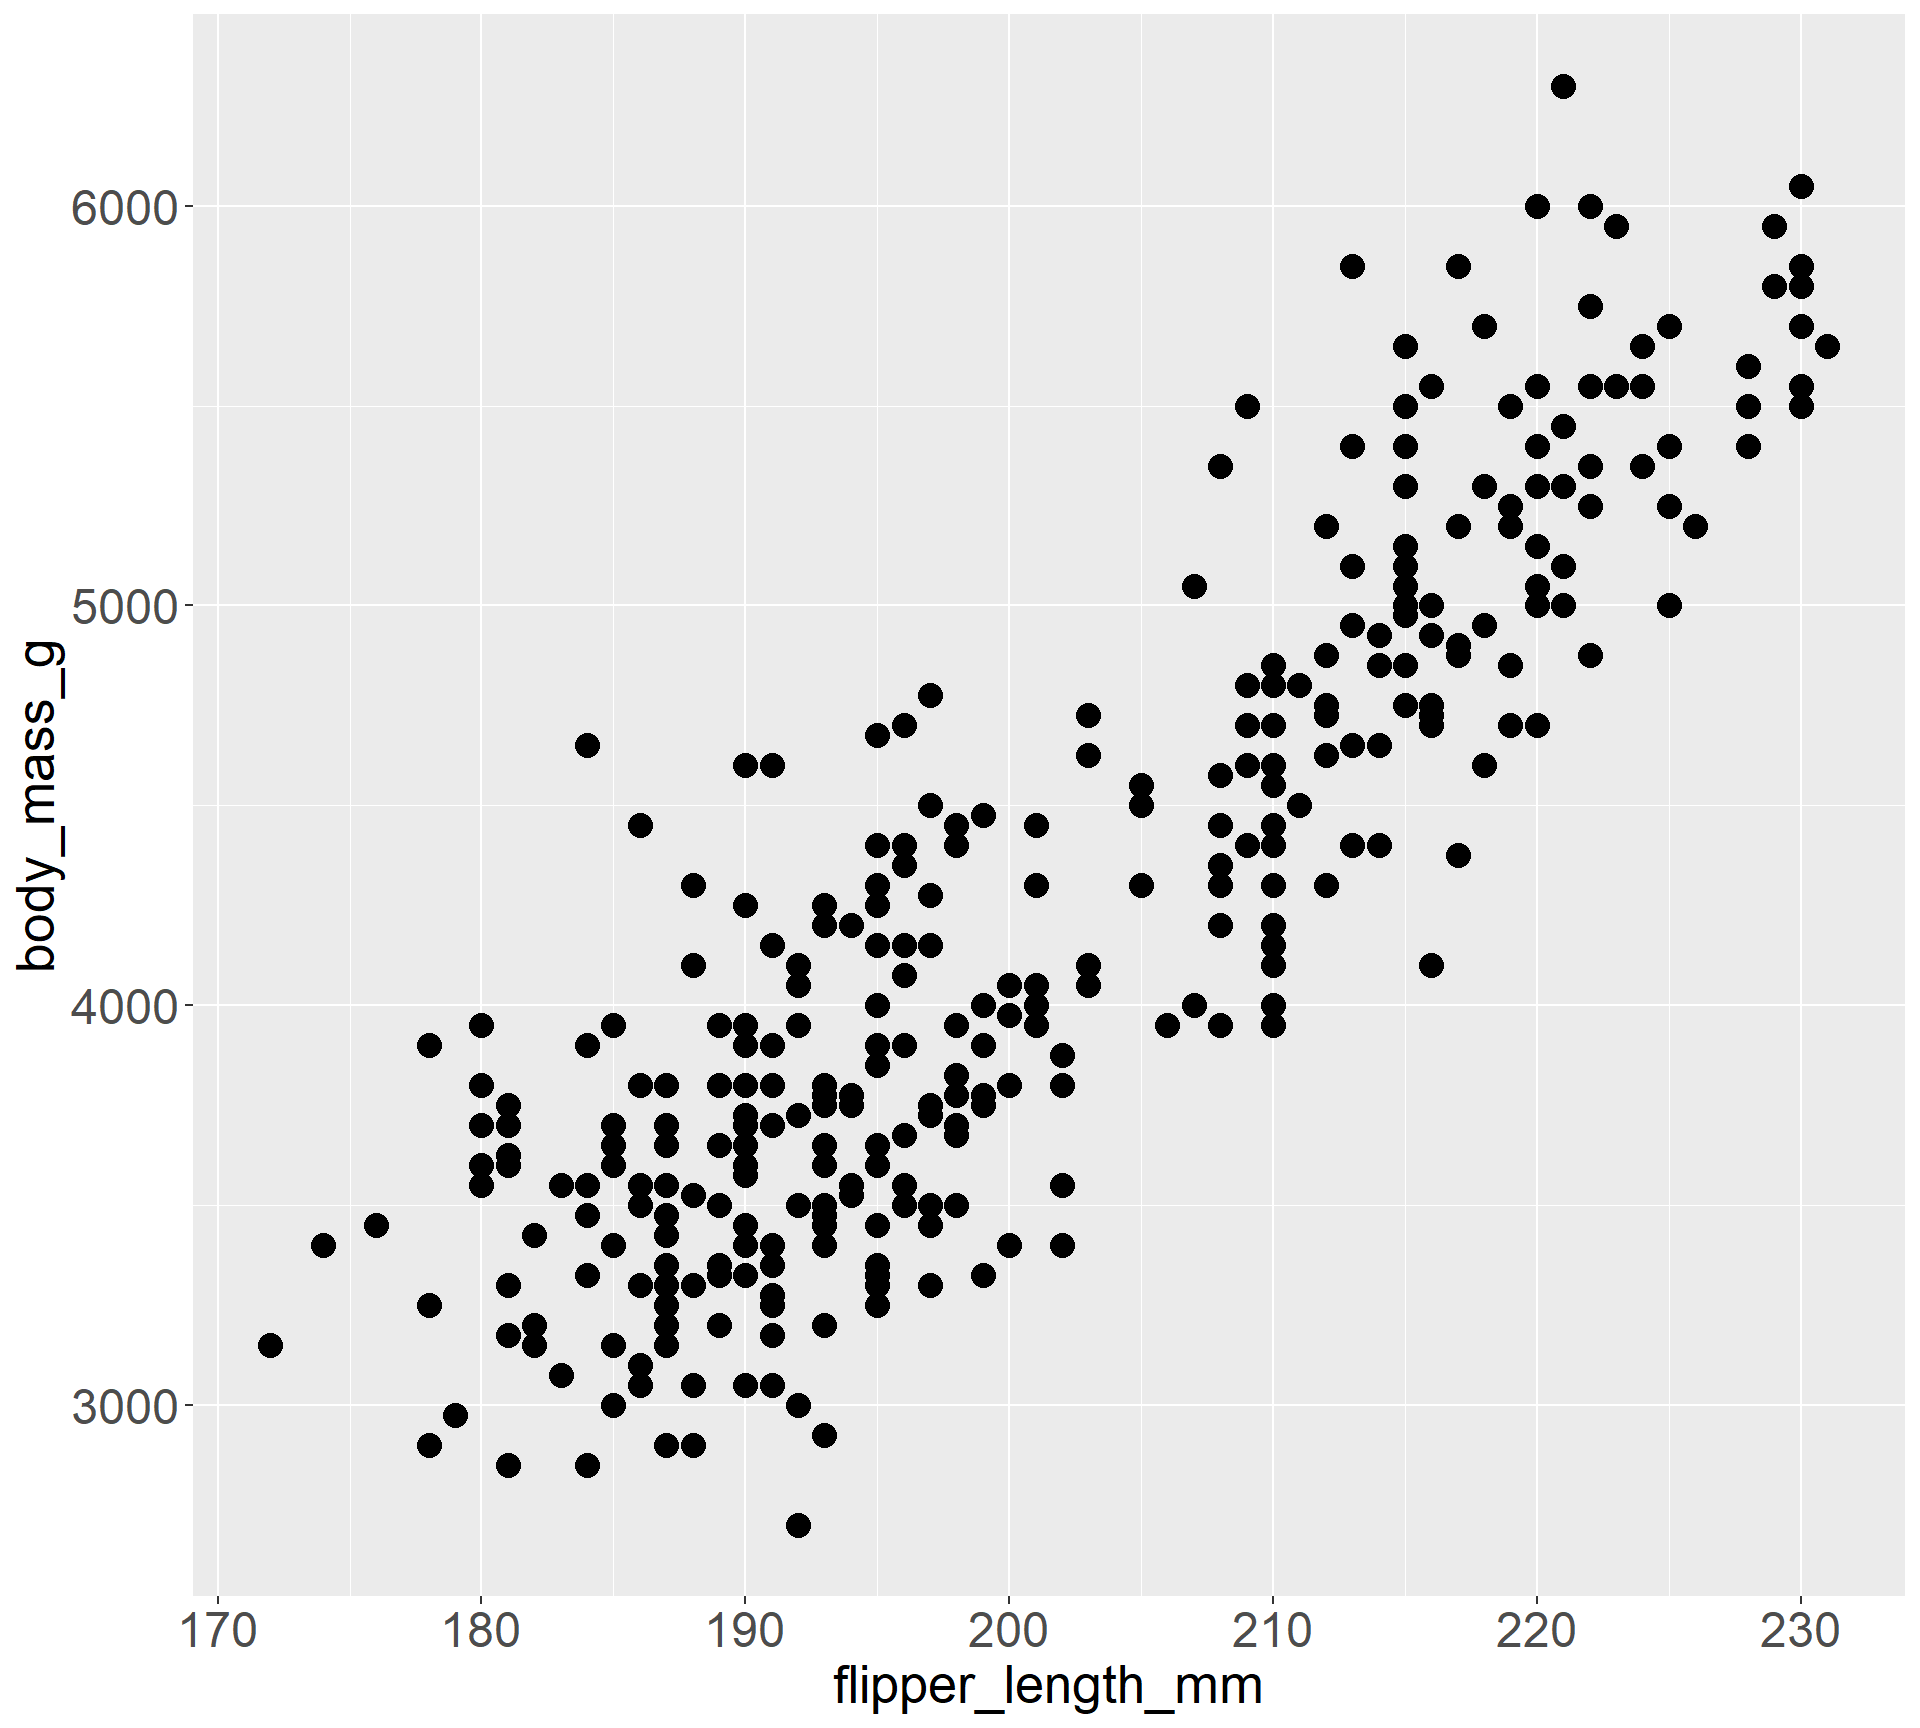
Creating a plot
library("palmerpenguins")

data("penguins")

penguins %>%
        ggplot(aes(x = flipper_length_mm,
                   y = body_mass_g)) +
        geom_point()
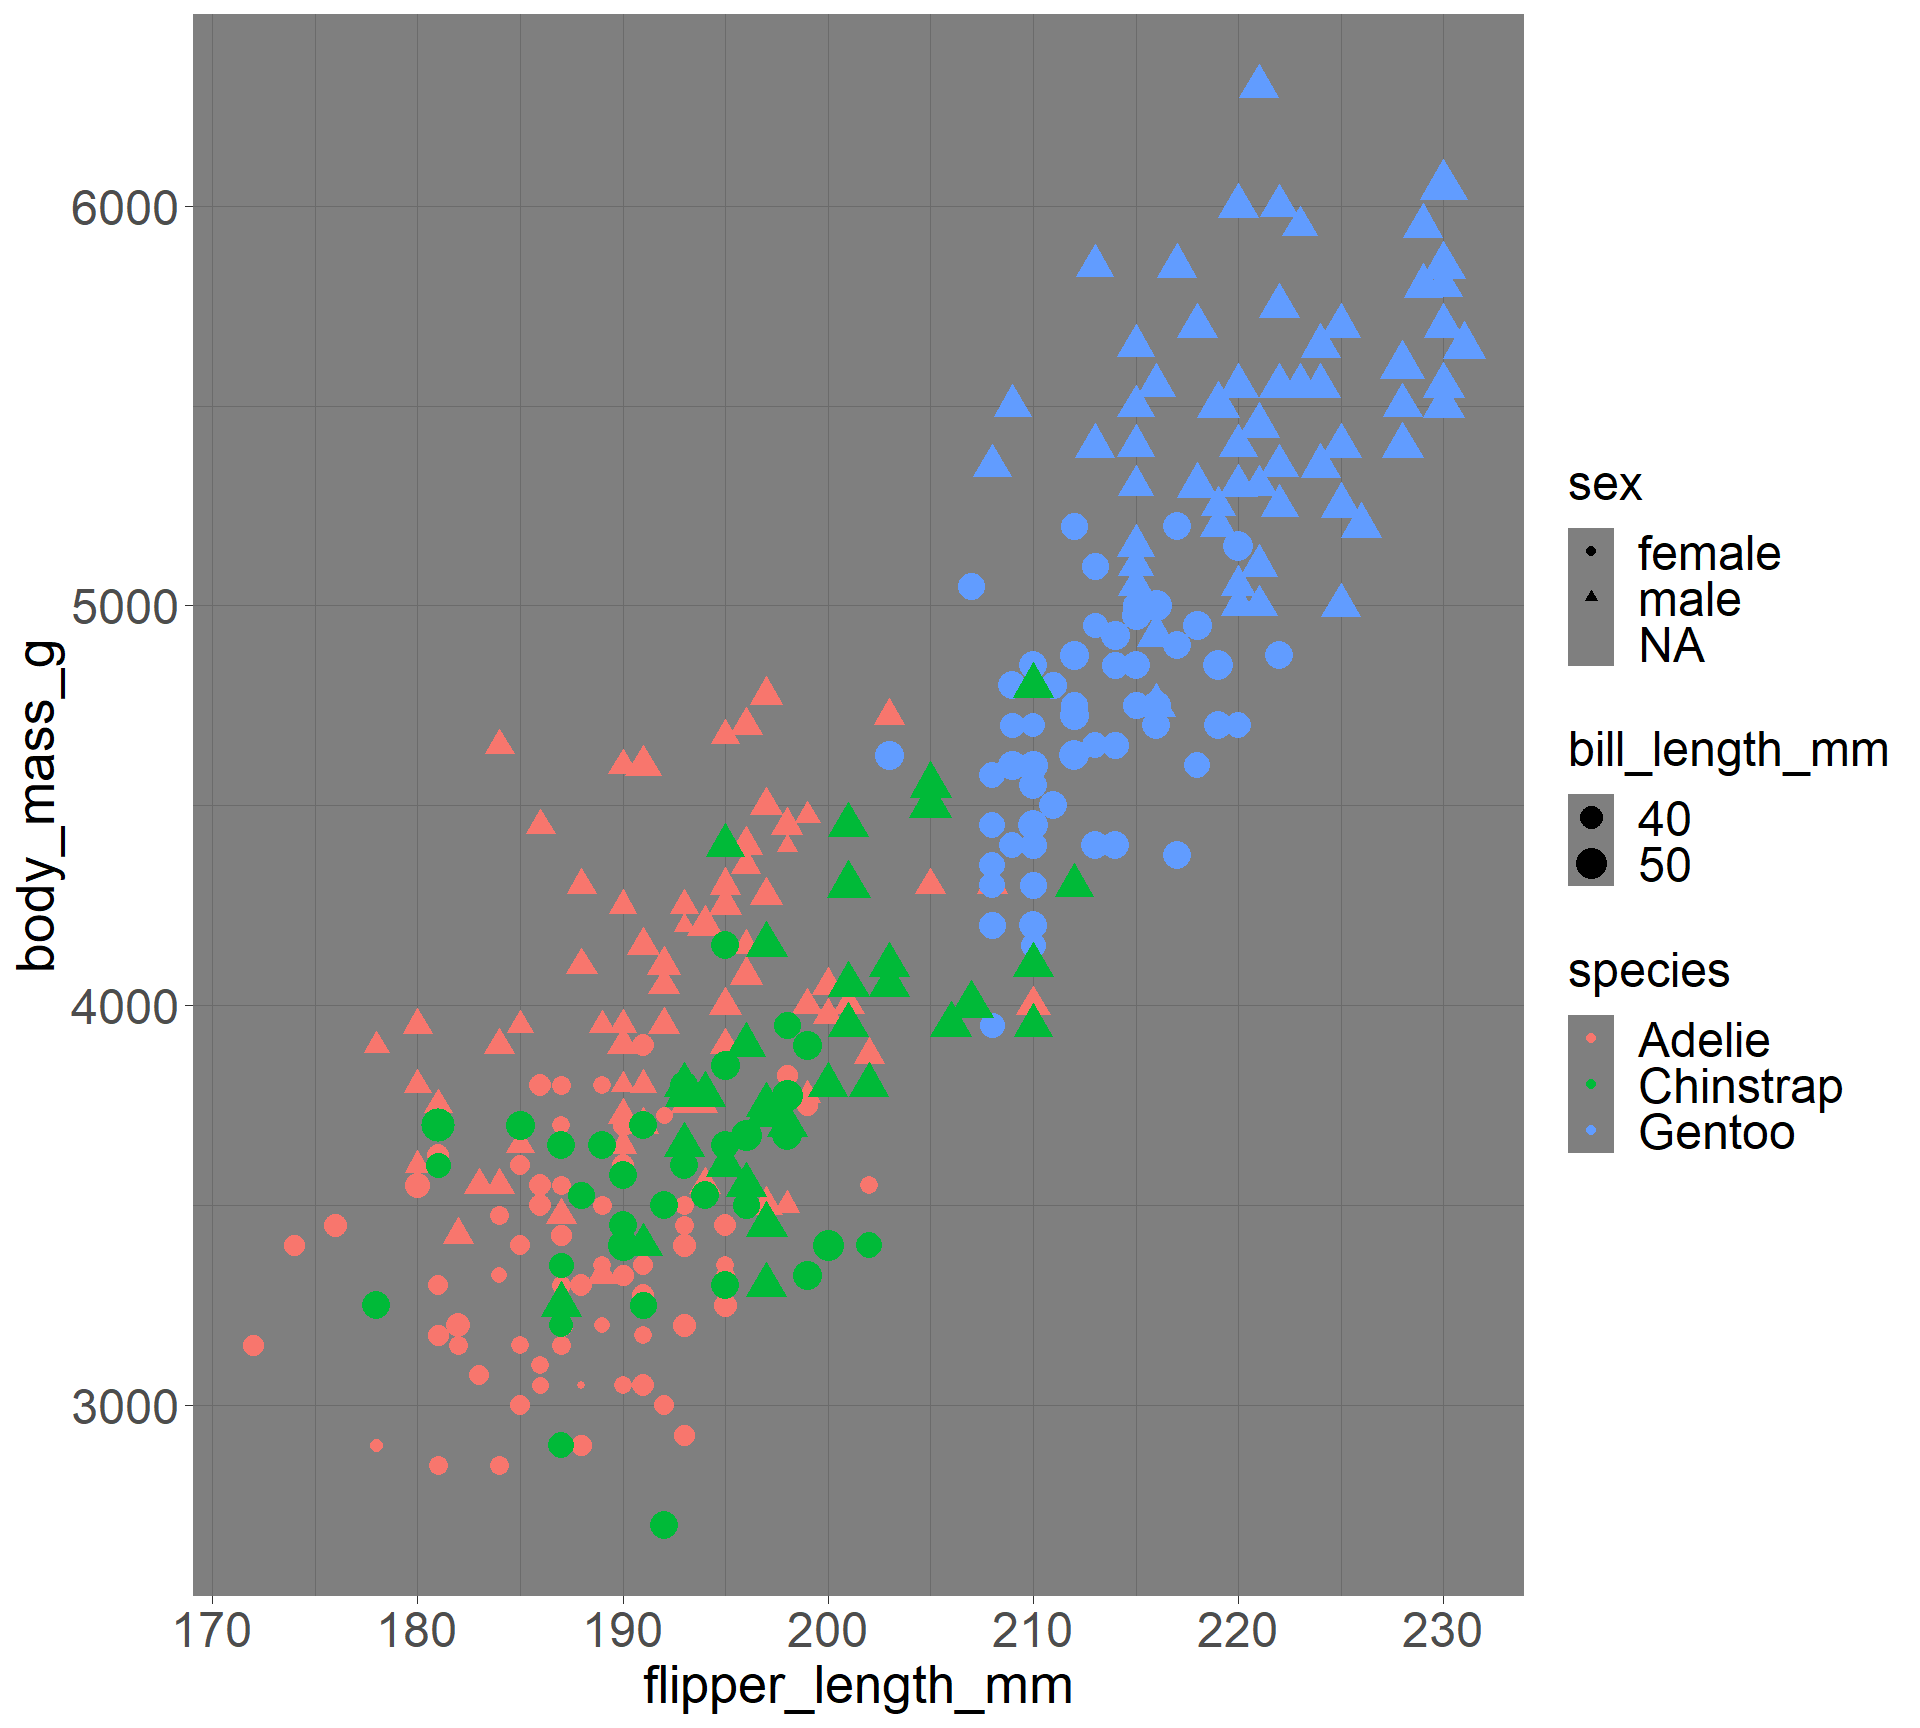
Mapping many variables
library("palmerpenguins")

data("penguins")

penguins %>%
        ggplot(aes(x = flipper_length_mm,
                   y = body_mass_g,
                   color = species,
                   shape = sex,
                   size = bill_length_mm)) +
        geom_point()
Mapping many variables and adding facets
library("palmerpenguins")

data("penguins")

penguins %>%
        ggplot(aes(x = flipper_length_mm,
                   y = body_mass_g,
                   color = species,
                   shape = sex,
                   size = bill_length_mm)) +
        geom_point() +
        facet_wrap(~ year)
Changing non-data aspects of the plot (theme())
library("palmerpenguins")

data("penguins")

penguins %>%
        ggplot(aes(x = flipper_length_mm,
                   y = body_mass_g,
                   color = species,
                   shape = sex,
                   size = bill_length_mm)) +
        geom_point() +

        theme_dark()
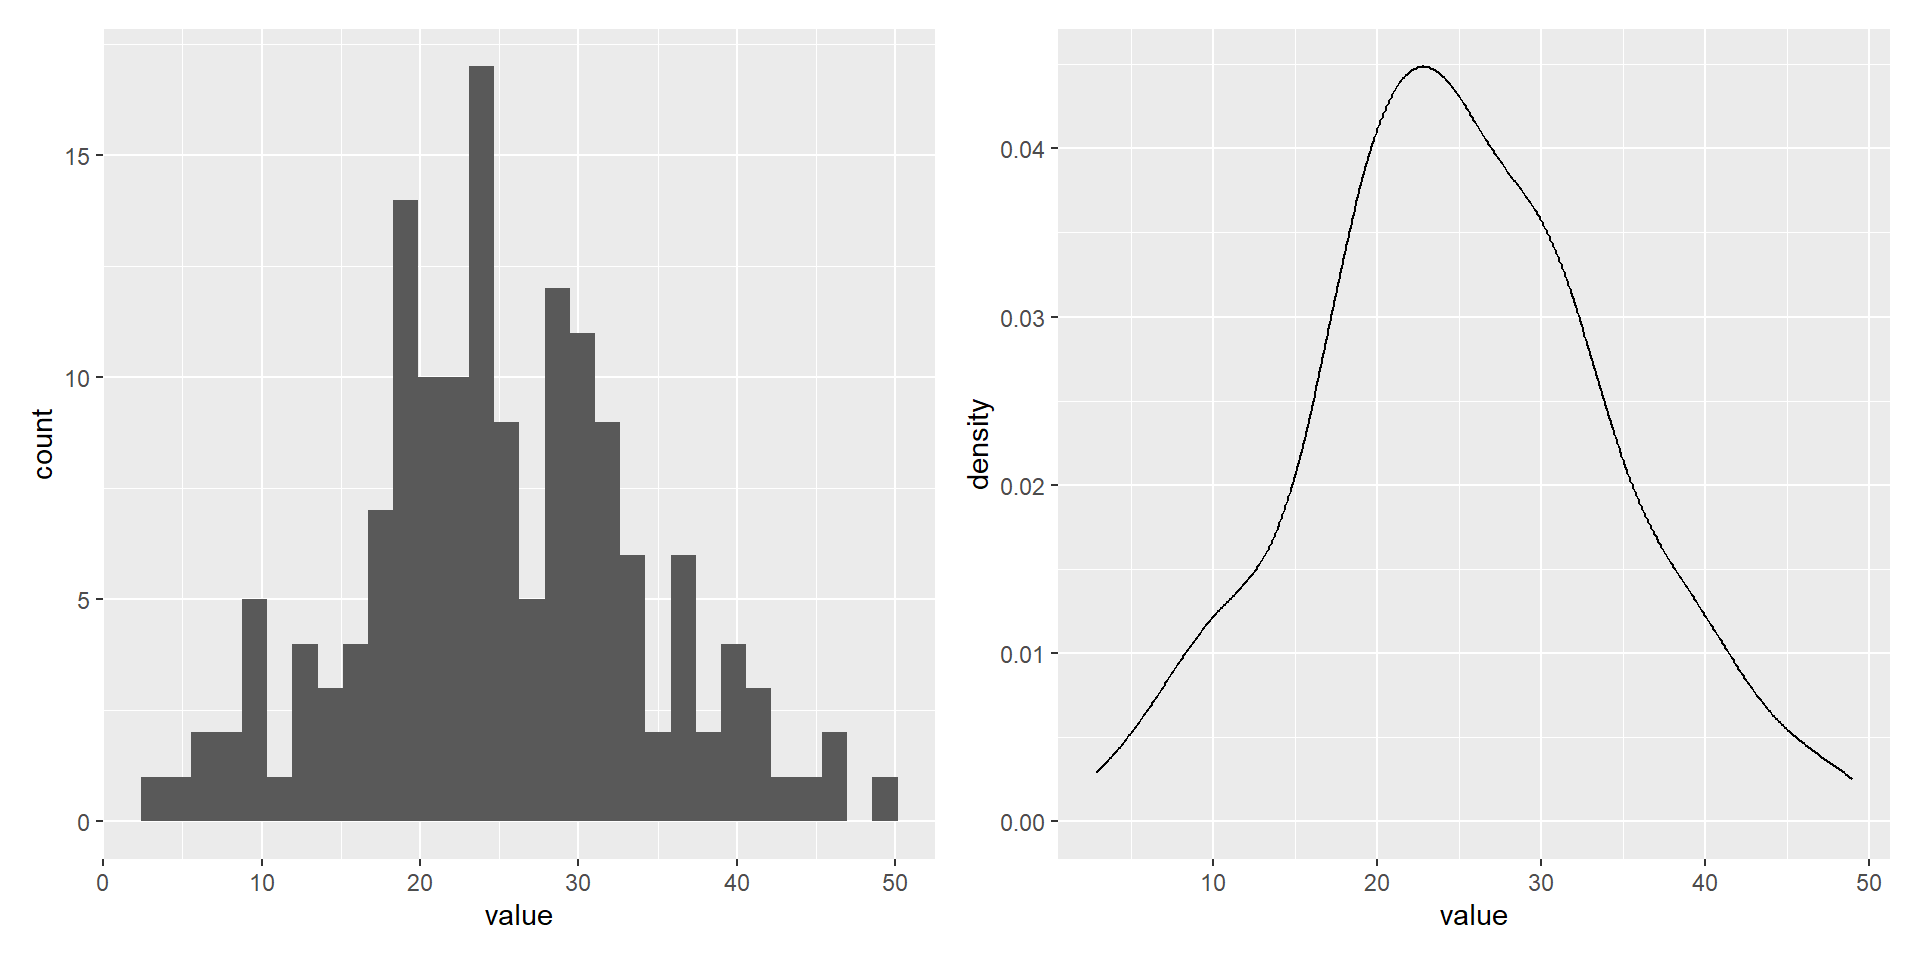
Common types of plots - Frequencies and densities
![]()
A continuous variable displayed in a Histogram and Density plot
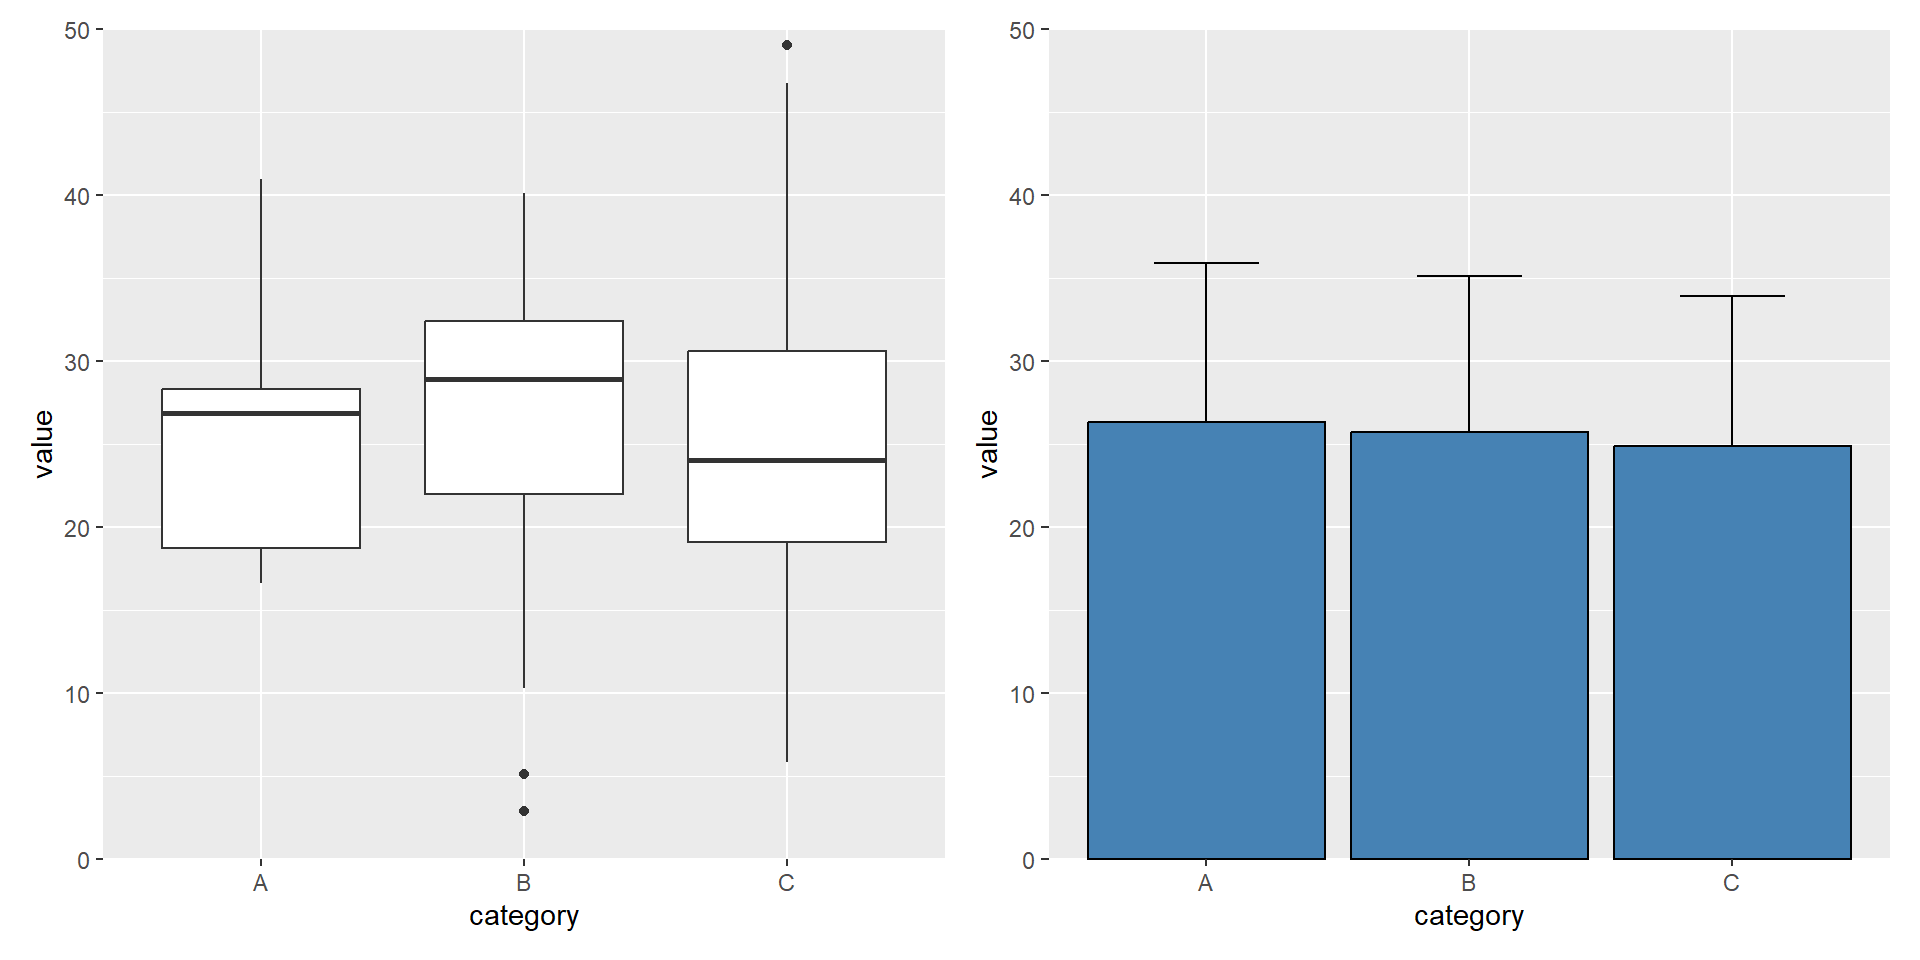
Common types of plots - Comparing categories
![]()
Comparison of a continous variable between categories using summary graphics
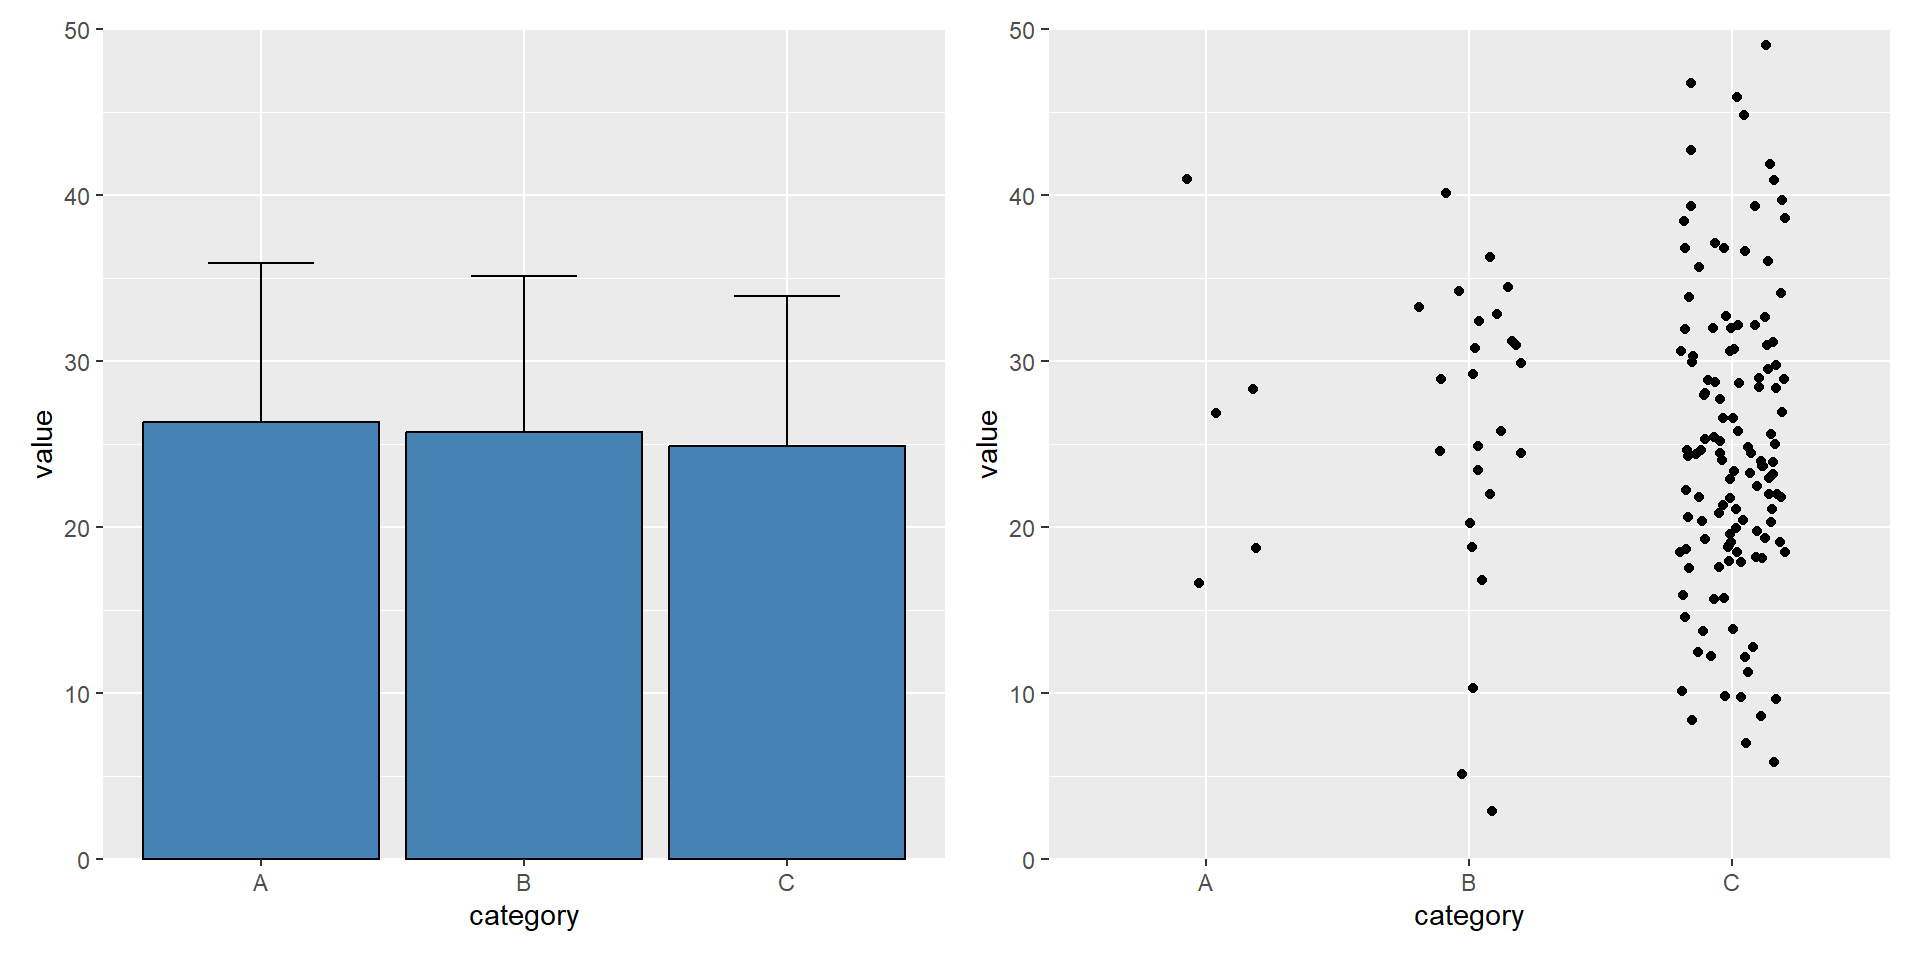
Common types of plots - Comparing categories without hiding data
![]()
Comparison of a continous variable between categories using summary graphics
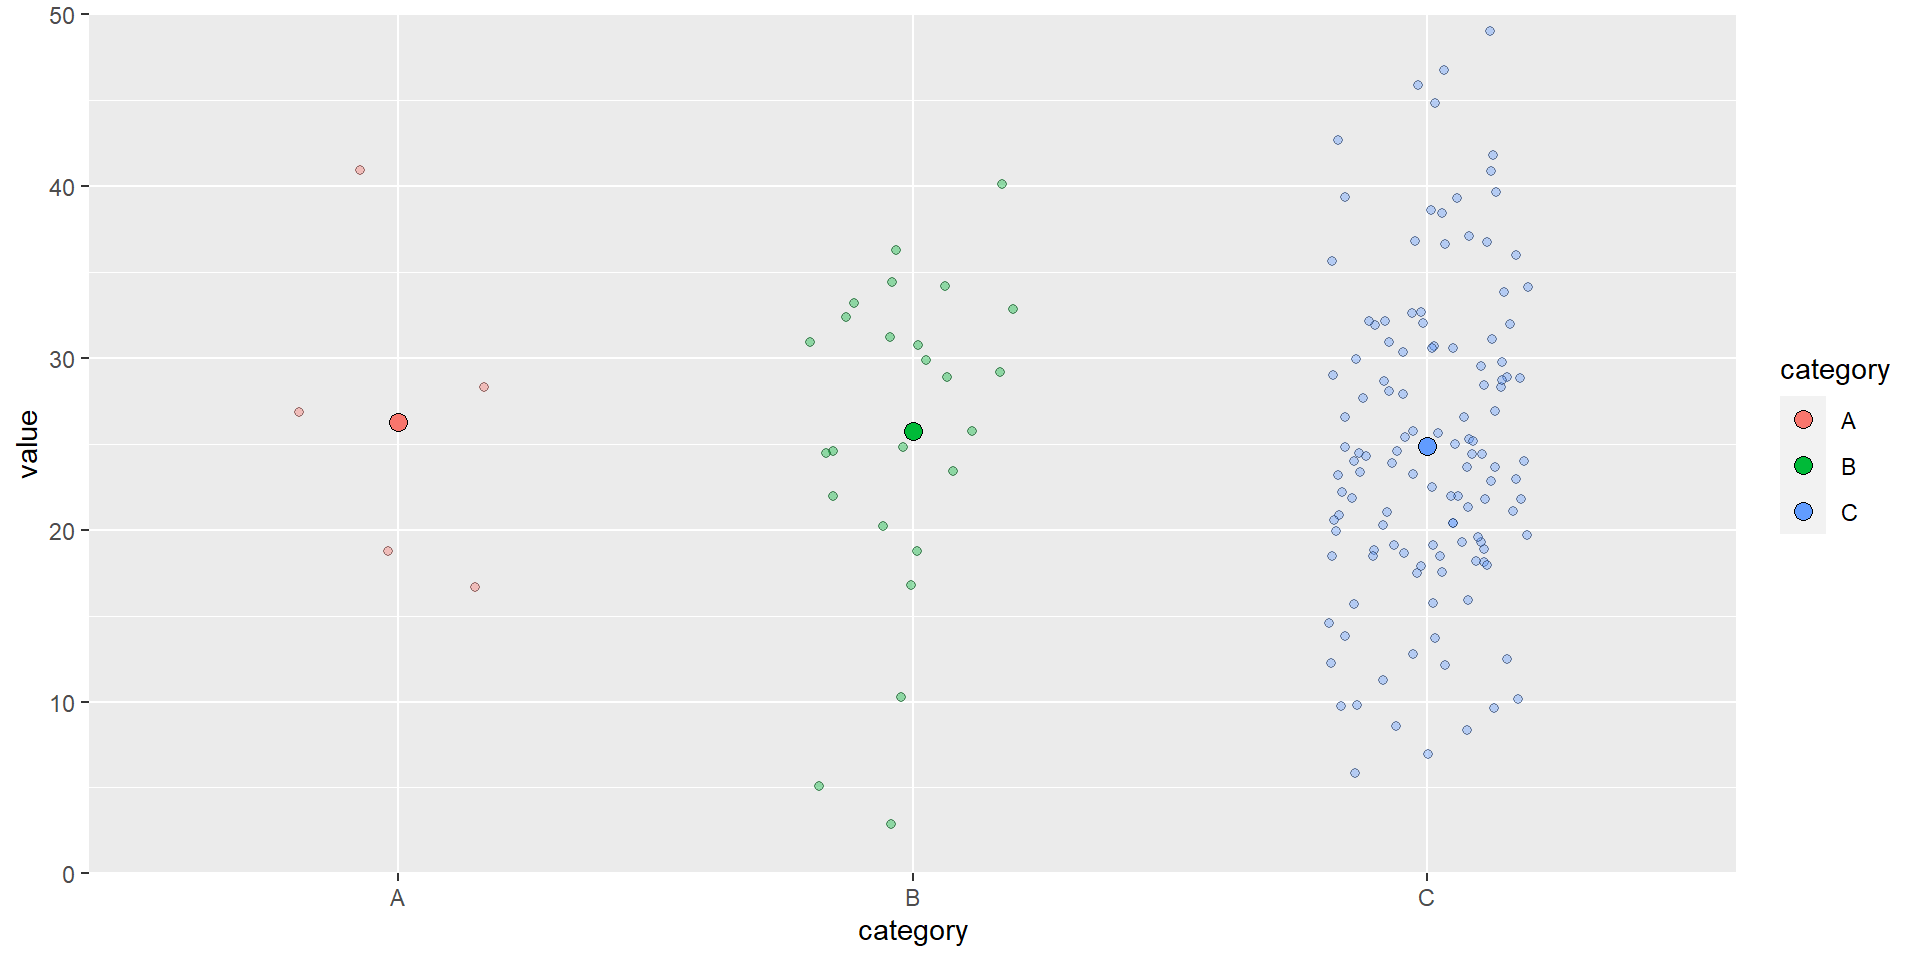
Common types of plots - Comparing categories highlighting differences
![]()
Comparison of a continous variable between categories using raw data and summaries
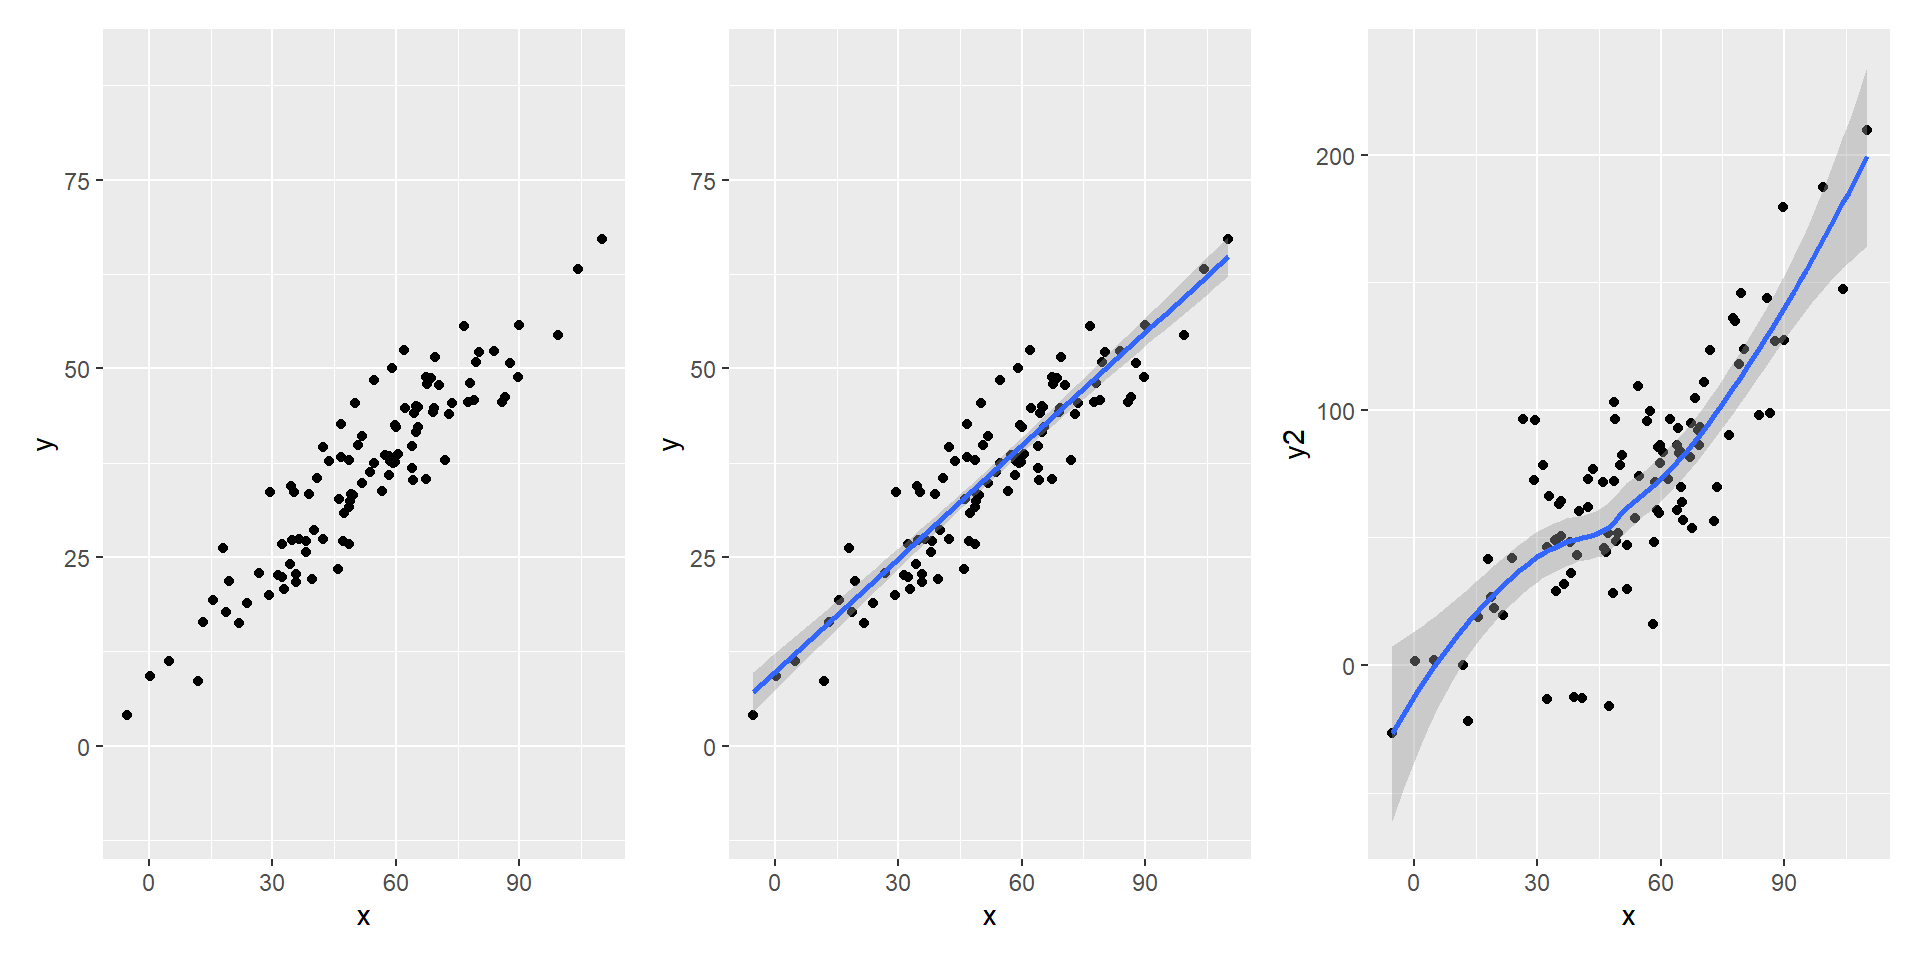
Common types of plots - Relationships between continuous variables
![]()
Highlighting relationships, raw data and summaries