Homework - reproducing figures

First steps

library(tidyverse)
3
Get an overview of the available variables
── Attaching core tidyverse packages ──────────────────────── tidyverse 2.0.0 ──
✔ dplyr     1.1.1     ✔ readr     2.1.4
✔ forcats   1.0.0     ✔ stringr   1.5.0
✔ ggplot2   3.4.1     ✔ tibble    3.2.1
✔ lubridate 1.9.2     ✔ tidyr     1.3.0
✔ purrr     1.0.1     
── Conflicts ────────────────────────────────────────── tidyverse_conflicts() ──
✖ dplyr::filter() masks stats::filter()
✖ dplyr::lag()    masks stats::lag()
ℹ Use the conflicted package (<http://conflicted.r-lib.org/>) to force all conflicts to become errors

child_heart <- read_csv("https://raw.githubusercontent.com/dspiegel29/ArtofStatistics/master/01-1-2-3-child-heart-survival-times/01-1-child-heart-survival-x.csv")
Rows: 13 Columns: 6
── Column specification ────────────────────────────────────────────────────────
Delimiter: ","
chr (1): Hospital
dbl (5): Operations, Survivors, Deaths, ThirtyDaySurvival, PercentageDying

ℹ Use `spec()` to retrieve the full column specification for this data.
ℹ Specify the column types or set `show_col_types = FALSE` to quiet this message.
3head(child_heart)
# A tibble: 6 × 6
  Hospital         Operations Survivors Deaths ThirtyDaySurvival PercentageDying
  <chr>                 <dbl>     <dbl>  <dbl>             <dbl>           <dbl>
1 London - Harley…        418       413      5              98.8             1.2
2 Leicester               607       593     14              97.7             2.3
3 Newcastle               668       653     15              97.8             2.2
4 Glasgow                 760       733     27              96.3             3.7
5 Southampton             829       815     14              98.3             1.7
6 Bristol                 835       821     14              98.3             1.7
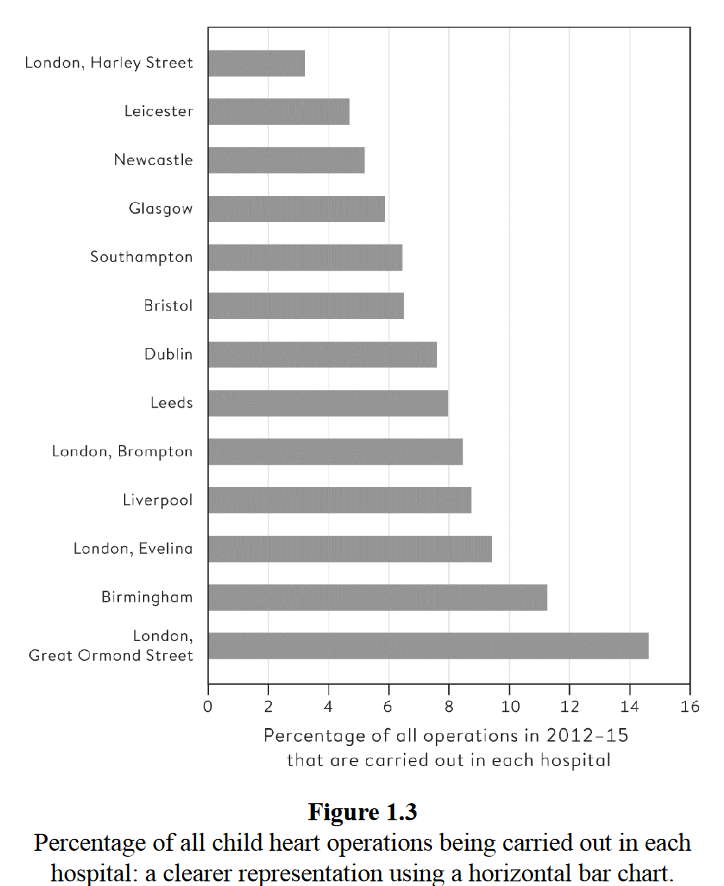
What should be the end result?

  • Calculate the proportion of operations to the total
  • Sort the variable hospital name based on proportion
  • Create a bar plot

Data wrangling

1child_heart$percentage_op <- 100 * (child_heart$Operations / sum(child_heart$Operations))
2child_heart$Hospital <- fct_reorder(child_heart$Hospital, child_heart$percentage_op)

child_heart$Hospital
1
Creating a new variable, operations per hospital expressed as a percentage of the total
2
Overwriting the existing variable Hospital with a factor variable
 [1] London - Harley Street       Leicester                   
 [3] Newcastle                    Glasgow                     
 [5] Southampton                  Bristol                     
 [7] Dublin                       Leeds                       
 [9] London - Brompton            Liverpool                   
[11] London - Evelina             Birmingham                  
[13] London - Great Ormond Street
13 Levels: London - Harley Street Leicester Newcastle Glasgow ... London - Great Ormond Street

Data wrangling alternative

child_heart <- child_heart %>%
1        mutate(percentage_op = 100 * (Operations / sum(Operations)),
2               Hospital = fct_reorder(Hospital, -percentage_op)) %>%
        print()
1
Creating a new variable, operations per hospital expressed as a percentage of the total
2
Overwriting the existing variable Hospital with a factor variable
# A tibble: 13 × 7
   Hospital        Operations Survivors Deaths ThirtyDaySurvival PercentageDying
   <fct>                <dbl>     <dbl>  <dbl>             <dbl>           <dbl>
 1 London - Harle…        418       413      5              98.8             1.2
 2 Leicester              607       593     14              97.7             2.3
 3 Newcastle              668       653     15              97.8             2.2
 4 Glasgow                760       733     27              96.3             3.7
 5 Southampton            829       815     14              98.3             1.7
 6 Bristol                835       821     14              98.3             1.7
 7 Dublin                 983       960     23              97.7             2.3
 8 Leeds                 1038      1016     22              97.9             2.1
 9 London - Bromp…       1094      1075     19              98.3             1.7
10 Liverpool             1132      1112     20              98.2             1.8
11 London - Eveli…       1220      1185     35              97.1             2.9
12 Birmingham            1457      1421     36              97.5             2.5
13 London - Great…       1892      1873     19              99               1  
# ℹ 1 more variable: percentage_op <dbl>

Building a bar plot

ggplot(data = child_heart, 
       aes(x = percentage_op, 
           y = Hospital)) + 
        geom_bar(stat = "identity")

Fixing axis labels

ggplot(data = child_heart, 
       aes(x = percentage_op, 
           y = Hospital)) + 
        geom_bar(stat = "identity") + 
        
        labs(x = "Percentage of all operations in 2012-15\nthat are carried out in each hospital") + 
        theme(axis.title.y = element_blank())

Fixing axis scales (x-axis)

ggplot(data = child_heart, 
       aes(x = percentage_op, 
           y = Hospital)) + 
        geom_bar(stat = "identity") + 
        
        scale_x_continuous(limits = c(0, 16), 
                           breaks = c(0, 2, 4, 6, 8, 10, 12, 14, 16), 
                           expand = c(0, 0)) +
        
        
        labs(x = "Percentage of all operations in 2012-15\nthat are carried out in each hospital") + 
        theme(axis.title.y = element_blank())

Removing reduntant grid lines, adding plot border, fixing plot background

ggplot(data = child_heart, 
       aes(x = percentage_op, 
           y = Hospital)) + 
        geom_bar(stat = "identity") + 
        
        scale_x_continuous(limits = c(0, 16), 
                           breaks = c(0, 2, 4, 6, 8, 10, 12, 14, 16), 
                           expand = c(0, 0)) +
        
        
        labs(x = "Percentage of all operations in 2012-15\nthat are carried out in each hospital") + 
        theme(axis.title.y = element_blank(), 
              panel.grid.major.y = element_blank(), 
              panel.grid.major.x = element_line(color = "gray70"), 
              panel.grid.minor.x = element_blank(), 
              panel.border = element_rect(color = "black", fill = NA), 
              panel.background = element_rect(fill = "white"))

Next steps?